Mean Reversion Pro Strategy [tradeviZion]Mean Reversion Pro Strategy : User Guide
A mean reversion trading strategy for daily timeframe trading.
Introduction
Mean Reversion Pro Strategy is a technical trading system that operates on the daily timeframe. The strategy uses a dual Simple Moving Average (SMA) system combined with price range analysis to identify potential trading opportunities. It can be used on major indices and other markets with sufficient liquidity.
The strategy includes:
Trading System
Fast SMA for entry/exit points (5, 10, 15, 20 periods)
Slow SMA for trend reference (100, 200 periods)
Price range analysis (20% threshold)
Position management rules
Visual Elements
Gradient color indicators
Three themes (Dark/Light/Custom)
ATR-based visuals
Signal zones
Status Table
Current position information
Basic performance metrics
Strategy parameters
Optional messages
📊 Strategy Settings
Main Settings
Trading Mode
Options: Long Only, Short Only, Both
Default: Long Only
Position Size: 10% of equity
Starting Capital: $20,000
Moving Averages
Fast SMA: 5, 10, 15, or 20 periods
Slow SMA: 100 or 200 periods
Default: Fast=5, Slow=100
🎯 Entry and Exit Rules
Long Entry Conditions
All conditions must be met:
Price below Fast SMA
Price below 20% of current bar's range
Price above Slow SMA
No existing position
Short Entry Conditions
All conditions must be met:
Price above Fast SMA
Price above 80% of current bar's range
Price below Slow SMA
No existing position
Exit Rules
Long Positions
Exit when price crosses above Fast SMA
No fixed take-profit levels
No stop-loss (mean reversion approach)
Short Positions
Exit when price crosses below Fast SMA
No fixed take-profit levels
No stop-loss (mean reversion approach)
💼 Risk Management
Position Sizing
Default: 10% of equity per trade
Initial capital: $20,000
Commission: 0.01%
Slippage: 2 points
Maximum one position at a time
Risk Control
Use daily timeframe only
Avoid trading during major news events
Consider market conditions
Monitor overall exposure
📊 Performance Dashboard
The strategy includes a comprehensive status table displaying:
Strategy Parameters
Current SMA settings
Trading direction
Fast/Slow SMA ratio
Current Status
Active position (Flat/Long/Short)
Current price with color coding
Position status indicators
Performance Metrics
Net Profit (USD and %)
Win Rate with color grading
Profit Factor with thresholds
Maximum Drawdown percentage
Average Trade value
📱 Alert Settings
Entry Alerts
Long Entry (Buy Signal)
Short Entry (Sell Signal)
Exit Alerts
Long Exit (Take Profit)
Short Exit (Take Profit)
Alert Message Format
Strategy name
Signal type and direction
Current price
Fast SMA value
Slow SMA value
💡 Usage Tips
Consider starting with Long Only mode
Begin with default settings
Keep track of your trades
Review results regularly
Adjust settings as needed
Follow your trading plan
⚠️ Disclaimer
This strategy is for educational and informational purposes only. It is not financial advice. Always:
Conduct your own research
Test thoroughly before live trading
Use proper risk management
Consider your trading goals
Monitor market conditions
Never risk more than you can afford to lose
📋 Release Notes
14 January 2025
Added New Fast & Slow SMA Options:
Fibonacci-based periods: 8, 13, 21, 144, 233, 377
Additional period: 50
Complete Fast SMA options now: 5, 8, 10, 13, 15, 20, 21, 34, 50
Complete Slow SMA options now: 100, 144, 200, 233, 377
Bug Fixes:
Fixed Maximum Drawdown calculation in the performance table
Now using strategy.max_drawdown_percent for accurate DD reporting
Previous version showed incorrect DD values
Performance metrics now accurately reflect trading results
Performance Note:
Strategy tested with Fast/Slow SMA 13/377
Test conducted with 10% equity risk allocation
Daily Timeframe
For Beginners - How to Modify SMA Levels:
Find this line in the code:
fastLength = input.int(title="Fast SMA Length", defval=5, options= )
To add a new Fast SMA period: Add the number to the options list, e.g.,
To remove a Fast SMA period: Remove the number from the options list
For Slow SMA, find:
slowLength = input.int(title="Slow SMA Length", defval=100, options= )
Modify the options list the same way
⚠️ Note: Keep the periods that make sense for your trading timeframe
💡 Tip: Test any new combinations thoroughly before live trading
"Trade with Discipline, Manage Risk, Stay Consistent" - tradeviZion
Recherche dans les scripts pour "profit factor"

MACD Aggressive Scalp SimpleComment on the Script
Purpose and Structure:
The script is a scalping strategy based on the MACD indicator combined with EMA (50) as a trend filter.
It uses the MACD histogram's crossover/crossunder of zero to trigger entries and exits, allowing the trader to capitalize on short-term momentum shifts.
The use of strategy.close ensures that positions are closed when specified conditions are met, although adjustments were made to align with Pine Script version 6.
Strengths:
Simplicity and Clarity: The logic is straightforward and focuses on essential scalping principles (momentum-based entries and exits).
Visual Indicators: The plotted MACD line, signal line, and histogram columns provide clear visual feedback for the strategy's operation.
Trend Confirmation: Incorporating the EMA(50) as a trend filter helps avoid trades that go against the prevailing trend, reducing the likelihood of false signals.
Dynamic Exit Conditions: The conditional logic for closing positions based on weakening momentum (via MACD histogram change) is a good way to protect profits or minimize losses.
Potential Improvements:
Parameter Inputs:
Make the MACD (12, 26, 9) and EMA(50) values adjustable by the user through input statements for better customization during backtesting.
Example:
pine
Copy code
macdFast = input(12, title="MACD Fast Length")
macdSlow = input(26, title="MACD Slow Length")
macdSignal = input(9, title="MACD Signal Line Length")
emaLength = input(50, title="EMA Length")
Stop Loss and Take Profit:
The strategy currently lacks explicit stop-loss or take-profit levels, which are critical in a scalping strategy to manage risk and lock in profits.
ATR-based or fixed-percentage exits could be added for better control.
Position Size and Risk Management:
While the script uses 50% of equity per trade, additional options (e.g., fixed position sizes or risk-adjusted sizes) would be beneficial for flexibility.
Avoid Overlapping Signals:
Add logic to prevent overlapping signals (e.g., opening a new position immediately after closing one on the same bar).
Backtesting Optimization:
Consider adding labels or markers (label.new or plotshape) to visualize entry and exit points on the chart for better debugging and analysis.
The inclusion of performance metrics like max drawdown, Sharpe ratio, or profit factor would help assess the strategy's robustness during backtesting.
Compatibility with Live Trading:
The strategy could be further enhanced with alert conditions using alertcondition to notify the trader of buy/sell signals in real-time.

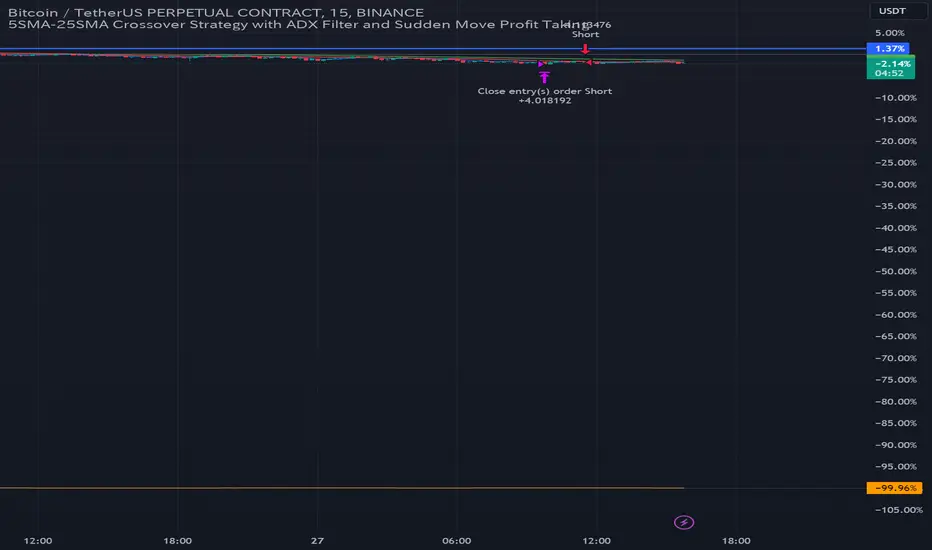
Golden Cross Strategy with Trend FilterHere's the English translation:
**Entry for Long Position:** Enter a long position only when the 5SMA crosses above the 25SMA and the current price is above the 75SMA.
**Entry for Short Position:** Enter a short position only when the 5SMA crosses below the 25SMA and the current price is below the 75SMA.
**Exit Position:** Hold the long position until a short signal is generated, and hold the short position until a long signal is generated.
By using the 75SMA to confirm the trend direction and taking positions only in alignment with that trend, you can enhance trading accuracy and potentially improve the profit factor.
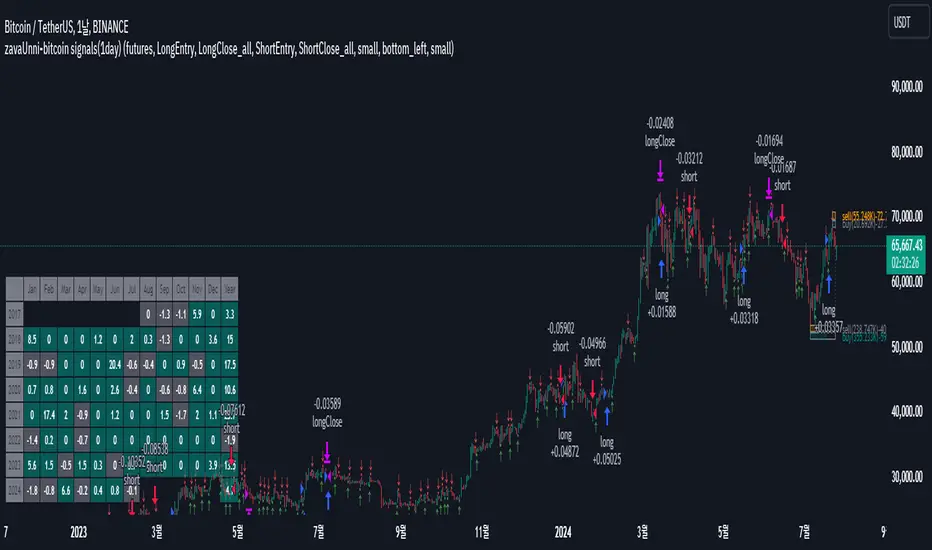
zavaUnni-bitcoin signals(1day)
📌 This strategy predicts price movements based on trading volume and enters positions accordingly. It calculates the expected price increase based on bullish volume and the expected price decrease based on bearish volume to determine the direction of the position.
Top predicted price based on declining bullish volume: top_ifpricebull
Bottom predicted price based on declining bearish volume: top_ifpricebear
Top predicted price based on increasing bullish volume: bot_ifpricebull
Bottom predicted price based on increasing bearish volume: bot_ifpricebear
Using these four values, the strategy calculates the final maxprice and minprice based on volume. If the price settles above the max value, it indicates an upward trend; if it settles below the min value, it indicates a downward trend.
📌 The indicator does not solely rely on the maxprice and minprice conditions. It incorporates complex and sophisticated analysis by considering average volume and candle size.
During a decline, if the average volume and spread of bullish candles exceed those of bearish candles and the price settles above the max value, a long position is entered.
During a rise, if the average volume and spread of bearish candles exceed those of bullish candles and the price settles below the min value, a short position is entered.
Even if the above conditions are met, if the buying pressure significantly outweighs the selling pressure, the position will be closed, but a reverse position will not be entered.
Reviewing historical data shows that while there are instances where the position switches from long to short immediately, there are also cases where the position is closed and re-entered after a few candles.
📌 Trading volume is one of the most traditional yet essential indicators, accurately reflecting price direction. This strategy, which simultaneously predicts fundamental trading volume and price changes, consistently achieves a profit factor above 3.
Characteristics and Historical Data of the Strategy
🔴 Short position entry: April 11, 2022
🟢 Long position entry after closing short: January 11, 2023
⚫ Short position holding period: 270 days
🟢 Long position entry: October 9, 2020
🔵 Long position exit: November 30, 2019
⚫ Long position holding period: 52 days
🟢 Long position entry: November 30, 2019
🔵 Long position exit: February 22, 2021
⚫ Long position holding period: 84 days
Settings Explanation
🛠️ In the input, you can choose between spot and futures. Buy and sell signals are generated in spot trading, while long and short signals are generated in futures trading.
🌈 You can configure the screen view.
Fibonacci Trend
Falling Fibonacci levels from the top: 382 and 618 levels (Red lines)
Rising Fibonacci levels from the bottom: 382 and 618 levels (Green lines)
When the price stays within the 382 and 618 levels of the falling Fibonacci, the background turns red; when it stays within the 382 and 618 levels of the rising Fibonacci, the background turns green.
Real-time Volume Strength of Bullish and Bearish Candles
Red arrow: Appears when the strength of bearish candles increases
Green arrow: Appears when the strength of bullish candles increases
Cumulative Volume of Bullish and Bearish Candles during the Trend
Cumulative data of falling bullish and bearish candles from the top
Cumulative data of rising bullish and bearish candles from the bottom
Profit Table
Provides annual and monthly profit tables.
Setting Options
You can change the options in the attributes to test different configurations.
📌 Trading Data
Although Binance data starts from 2017, limiting the number of trades to 60 as of July 2024, this does not undermine the validity of the strategy. Binance provides reliable volume data, which is crucial for evaluating the strategy's performance. In contrast, exchanges like Bitstamp may have longer trading histories but insufficient volume to properly assess the strategy's actual performance. A volume-based strategy cannot be reliably tested on an exchange with low trading volume. Therefore, despite the limited number of trades on Binance, its reliable volume data justifies its use for this strategy.
► Backtesting Details:
Timeframe: 1D / Bitcoin / TetherUS
Initial Balance: $50,000 (Enter the initial capital you will invest)
Order Size: 10% (Enter the percentage of your account balance you will trade)
Commission: 0.04% (Enter the trading commission)
Slippage: 10 ticks (Enter the slippage you want to test)
When using the strategy:
📢 Timeframe: While the strategy performs well on timeframes lower than daily, it is particularly profitable on the daily timeframe.
📢 Exchange: It is recommended to use Binance due to its reliable volume data.
📢 This strategy is suitable for traders who have the patience to hold positions for extended periods, as it calculates the size of bullish and bearish candles carefully and does not change positions easily.
📢 Spot trading is recommended over futures, and if using futures, leverage should be limited to a maximum of 2x.
RunRox - Backtesting System (SM)RunRox - Backtesting System (SM) is designed for flexible and comprehensive testing of trading strategies, closely integrated with our RunRox - Signals Master indicator. This combination enhances your ability to refine strategies efficiently, providing you with insights to adapt and optimize your trading tactics seamlessly.
The Backtesting System (SM) excels in pinpointing the optimal settings for the RunRox - Signals Master indicator, efficiently highlighting the most effective configurations.
Capabilities of the Backtesting System (SM)
Optimal Settings Determination: Identifies the best configurations for the Signals Master indicator to enhance its effectiveness.
Timeframe-Specific Strategy Testing: Allows strategies to be tested over specific historical time periods to assess their viability.
Customizable Initial Conditions: Enables setting of initial deposit, risk per trade, and commission rates to mirror real-world trading conditions.
Flexible Money Management: Provides options to set take profits and stop losses, optimizing potential returns and risk management.
Intuitive Dashboard: Features a user-friendly dashboard that visually displays all pertinent information, making it easy to analyze and adjust strategies.
Trading Flexibility Across Three Modes:
Dual-Direction Trading: Engage in both buying and selling with this mode. Our dashboard optimizes and identifies the best settings for trading in two directions, streamlining the process to maximize effectiveness for both buy and sell orders.
Buy-Only Mode: Tailored for traders focusing exclusively on purchasing assets. In this mode, our backtester pinpoints the most advantageous sensitivity, speed reaction, and filter settings specifically for buying. Optimal settings in this mode may differ from those used in dual-direction trading, providing a customized approach to single-direction strategies.
Sell-Only Mode: Perfect for strategies primarily based on selling. This setting allows you to discover the ideal configurations for asset sales, which can be particularly useful if you are looking for optimal exit points in long-term transactions or under specific market conditions.
Here's an example of how profits can differ on the same asset when trading using two distinct strategies: exclusively buying or trading in both directions.
Above in the image, you can see how one-directional trading influences the results of backtests on historical data. While this does not guarantee future outcomes, it provides insight into how the strategy's performance can vary with different trading directions.
As you can also see from the image, one-directional trading has affected the optimal combination of settings for Sensitivity, Speed Reaction, and Filters.
Stop Loss and Take Profit
Our backtesting system, as you might have gathered, includes flexible settings for take profits and stop losses. Here are the main features:
Multiple Take Profits: Ability to set from 1 to 4 take profit levels.
Fixed Percentage: Option to assign a fixed percentage for each take profit.
Trade Proportion Fixation: Ability to set a fixed size from the trade for securing profits.
Stop Loss Installation: Option to establish a stop loss.
Break-Even Stop Loss: Ability to move the stop loss to a break-even point upon reaching a specified take profit level.
These settings offer extensive flexibility and can be customized according to your preferences and trading style. They are suitable for both novice and professional traders looking to test their trading strategies on historical data.
As illustrated in the image above, we have implemented money management by setting fixed take profits and stop losses. Utilizing money management has improved indicators such as profit, maximum drawdown, and profit factor, turning even historically unprofitable strategies into profitable ones. Although this does not guarantee future results, it serves as a valuable tool for understanding the effectiveness of money management.
Additionally, as you can see, the optimal settings for Signals Master have been adjusted, highlighting the best configurations for the most favorable outcomes.
Disclaimer:
Historical data is not indicative of future results. All indicators and strategies provided by RunRox are intended for integration with traders' strategies and should be used as tools for analysis rather than standalone solutions. Traders should use their own discretion and understand that all trading involves risk.

Smart Money Concept + Strategy Backtesting Toolkit [Shah]This indicator, primarily designed for strategy backtest. It’s important to emphasize that the orders generated by this indicator are in the form of stop-limit orders .
For Long setup , When lower lows and lower highs form, after price moving up from the last higher high, a “change of character” occurs. Entry will takes place in the golden zone.
This the Long setup:
And this is the Long setup Example on chart:
For Short setup , When higher lows and higher highs form after the price moves down from the last higher low, a “change of character” occurs. Entry will take place within the golden zone.
This the Short setup:
And this is the Short setup Example on chart:
Key Features:
Date Period:
Users can customize the date period during which the strategy is tested, allowing for a more granular analysis of performance over specific timeframes.
DCA Entry:
Entry is based on Fibonacci level between the Lower Low and Higher High pivots for Long deals .
Entry is based on Fibonacci level between the Higher High and Lower Low pivots for Short deals .
Allowing a second entry with a specified position size
Entering at a different price based on a Percent or ATR change.
There is a feature that If the risk-to-reward ratio is below the specified input (rr), the trading deal wont initiate, and the signal alert wont be triggered.
Stop Loss:
Adjustable based on Fibonacci levels , Percent and ATR.
The percent and ATR is calculate from LL pivot point for Long and HH pivot point for short (not Entry price)’
Targets:
Adjustable based on Source, Fibonacci levels , Percent and ATR.
Source indicates the maximum (minimum) value between the open and close of the candle where the Higher High (Lower Low) pivot point was formed for Long (Short) deals.
Percent and ATR calculates from Entry 1 Price
There is a feature that closes the part of the position size at Target 1 based on a percentage, leaving the rest to close at Target 2, entry, exit price, or stop loss.
Plots:
The visual representation of the indicator includes the key plots:
Reset Deal Calculation Fibonacci Level
Alert Fire Fibonacci Level
Entry 1
Entry 2
Entry Average
Stop Loss
Target 1
Target 2
Labels:
Displays informative labels upon trade open and close, providing details about each transaction like gain and equity and etc.
Risk Management:
Allows setting initial capital, risk per trade, and commission for each transaction.
Score Table:
Provides statistical information for Regular deals (refers to deals that closed in Target price or Stop loss price) and Exited deals (representing deals that didn’t touch the stop loss or targets.):
Number of trades
Win rate
Profit factor
Average Risk to Reward ratio
Total Profit and Loss (PnL)
Commission paid
Live equity
It should note that Winrate calculated based on closed deals at target or stop loss. (Exited trades doesn’t into account in calculation of Winrate)
Exit Methods :
The goal is to offer users a diverse set of exits before the price touches the target or stop loss.
1. Pending Entry Time-out
cancel pending entry based on candle counting since alert fired. (before deal started)
2. Break Even
If Target 2 is reached, the stop loss automatically adjusts to the entry price.
3. Active Deal Reverse
If a deal (long or short position) is currently open, and the reverse signal is emitted, the script will close the existing deal.
4. Reverse Deal Exit
If a deal (long or short position) is currently open, and the reverse signal is emitted, the script will automatically close the existing deal.
5. Move Exit
With this method, if Entry 2 is triggered, the deal will be closed when the price touches the Entry price.
6. Candle Counting Exit
This exit type is based on the number of candles since the deal started.
7. Profit Zone Shield Exit
Once a deal enters profit, the Exit level moves to the entry level after reaching a Fibonacci level between TP1 and Entry 1.
Deep Backtesting Table:
It includes:
Time period of the backtest
Pair name and timeframe
Count the long and short trades
Win streak and loss streak
Total deal chances and missed chances
Count the deals goes directly from entry 1 to tp1 and entry 2 to tp1
Count the deals that touched entry 2 and entry 2 filled percent
Count the number of each exit type
Other statistics such as CAGR, Sharpe, Kurtosis, Skewness, and Max Drawdown.

Backtest any Indicator v5Happy Trade,
here you get the opportunity to backtest any of your indicators like a strategy without converting them into a strategy. You can choose to go long or go short and detailed time filters. Further more you can set the take profit and stop loss, initial capital, quantity per trade and set the exchange fees. You get an overall result table and even a detailed, scroll-able table with all trades. In the Image 1 you see the provided info tables about all Trades and the Result Summary. Further more every trade is marked by a background color, Labels and Levels. An opening Label with the trade direction and trade number. A closing Label again with the trade number, the trades profit in % and the total amount of $ after all past trades. A green line for the take profit level and a red line for the stop loss.
Image 1
Example
For this description we choose the Stochastic RSI indicator from TradingView as it is. In Image 2 is shown the performance of it with decent settings.
Timeframe=45, BTCUSD, 2023-08-01 - 2023-10-20
Stoch RSI: k=30, d=40, RSI-length=140, stoch-length=140
Backtest any Indicator: input signal=Stoch RSI, goLong, take profit=9.1%, stop loss=2.5%, start capital=1000$, qty=5%, fee=0.1%, no Session Filter
Image 2
Usage
1) You need to know the name of the boolean (or integer) variable of your indicator which hold the buy condition. Lets say that this boolean variable is called BUY. If this BUY variable is not plotted on the chart you simply add the following code line at the end of your pine script.
For boolean (true/false) BUY variables use this:
plot(BUY ? 1:0,'Your buy condition hold in that variable BUY',display = display.data_window)
And in case your script's BUY variable is an integer or float then use instate the following code line:
plot(BUY ,'Your buy condition hold in that variable BUY',display = display.data_window)
2) Probably the name of this BUY variable in your indicator is not BUY. Simply replace in the code line above the BUY with the name of your script's trade condition variable.
3) Save your changed Indicator script.
4) Then add this 'Backtest any Indicator' script to the chart ...
5) and go to the settings of it. Choose under "Settings -> Buy Signal" your Indicator. So in the example above choose .
The form is usually: ' : BUY'. Then you see something like Image 2
6) Decide which trade direction the BUY signal should trigger. A go Long or a go Short by set the hook or not.
Now you have a backtest of your Indicator without converting it into a strategy. You may change the setting of your Indicator to the best results and setup the following strategy settings like Time- and Session Filter, Stop Loss, Take Profit etc. More of it below in the section Settings Menu.
Appereance
In the Image 2 you see on the right side the List of Trades . To scroll down you go into the settings again and decrease the scroll value. So you can see all trades that have happened before. In case there is an open trade you will find it at the last position of the list.
Every Long trade is green back grounded while Short trades are red.
Every trade begins with a label that show goLong or goShort and its number. And ends with another label again with its number, Profit in % and the resulting total amount of cash.
If activated you further see the Take Profit as a green line and the Stop Loss as a orange line. In the settings you can set their percentage above or below the entry price.
You also see the Result Summary below. Here you find the usual stats of a strategy of all closed trades. The profit after total amount of fees , amount of trades, Profit Factor and the total amount of fees .
Settings Menu
In the settings menu you will find the following high-lighted sections. Most of the settings have a question mark on their right side. Move over it with the cursor to read specific explanation.
Input Signal of your Indicator: Under Buy you set the trade signal of your Indicator. And under Target you set the value when a trade should happen. In the Example with the Stochastic RSI above we used 20. Below you can set the trade direction, let it be go short when hooked or go long when unhooked.
Trade Settings & List of Trades: Take Profit set the target price of any trade. Stop Loss set the price to step out when a trade goes the wrong direction. Check mark the List of Trades to see any single trade with their stats. In case that there are more trades as fits in the list you can scroll down the list by decrease the value Scroll .
Time Filter: You can set a Start Time or deactivate it by leave it unhooked. The same with End Time .
Session Filter: here you can choose to activate it on weekly base. Which days of the week should be trading and those without. And also on daily base from which time on and until trade are possible. Outside of all times and sessions there will be no new trades if activated.
Invest Settings: here you can choose the amount of cash to start with. The Quantity percentage define for every trade how much of the cash should be invested and the Fee percentage which have to be payed every trade. Open position and closing position.
Other Announcements
This Backtest script don't use the strategy functions of TradingView. It is programmed as an indicator. All trades get executed at candle closing. This script use the functionality "Indicator-on-Indicator" from TradingView.
Conclusion
So now it is your turn, take your promising indicators and connect it to that Backtest script. With it you get a fast impression of how successful your indicator will trade. You don't have to relay on coders who maybe add cheating code lines. Further more you can check with the Time Filter under which market condition you indicator perform the best or not so well. Also with the Session Filter you can sort out repeating good market conditions for your indicator. Even you can check with the GoShort XOR GoLong check mark the trade signals of you indicator in opposite trade direction with one click. And compare your indicators under the same conditions and get the results just after 2 clicks. Thanks to the in-build fee setting you get an impression how much a 0.1% fee cost you in total.
Cheers

MMI Auto Backtesting StrategyDescription:
A strategy based on ATR with auto-backtesting capabilities, Take Profit and Stop Loss (either Normal or Trailing). It allows you to select ranges of values and step for each parameter, and backtest the strategy on a multitude of input combinations at once. You can alternatively use a constant value for each parameter. The backtesting results strive to be as close as possible to those given by Tradingview Strategy Tester.
The strategy displays a table with results for different input combinations. This has columns showing current input combination as well as the following stats: Net Profit, Number of trades, % of Profitable trades, Profit Factor, Max Drawdown, Max Runup, Average Trade and Average number of bars in a trade.
You can sort the table by any column (including sorting by multiple columns at the same time) to find, for example, input combination that gives highest Net Profit (or, if sorting by multiple columns, to find input combination with the best balance of Net Profit and % of Profitable trades). You can filter by any column as well (or multiple columns at the same time), using logical expressions like "< value", "> value", "<= value", ">= value". And you can use logical expressions like "< value%" for Net Profit, Max Drawdown, Max Runup and Average trade to filter by percentage value. You will see a "↓" symbol in column's header if that column is sorted from Highest to Lowest, a "↑" symbol if it's sorted from Lowest to Highest and a "𐕢" symbol if that column is being filtered.
The table has customisable styles (like text color, background color of cells, etc.), and can show the total number of backtested combinations with the time taken to test them. You can also change Initial Capital and Position Size (either Contracts, Currency or % of Equity).
Parameters:
The following parameters are located in the "INPUTS (USUAL STRATEGY)" group, and control the behaviour of strategy itself (not the auto-backtesting functionality):
- Period: ATR Length
- Multiplier: ATR Multiplier
- DPO: length of the filtering moving average
- SL: stop loss
- TP: take profit
- Use Stop Loss: enable stop loss
- Stop Loss Mode: stop loss mode (either Normal or Trailing)
- Use Take Profit: enable take profit
- Wicks: use high & low price, or close price
The strategy also has various parameters separated by different groups:
- INPUTS (AUTO-BACKTESTING): has the same parameters as the "INPUTS (USUAL STRATEGY)" group, but controls the input combinations for auto-backtesting; all the numeric parameters have 3 values: F/V (from), T (to) and S (step); if the checkbox to the left of F/V parameter is off, the value of F/V will indicate the constant value used for that parameter (if the checkbox is on, the values will be from F/V to T using step S)
- STRATEGY: contains strategy related parameters like Initial Capital and Position Size
- BACKTESTING: allows you to display either Percentage, Absolute or Both values in the table and has checkboxes that allow you to exclude certain columns from the table
- SORTING: allows you to select sorting mode (Highest to Lowest or vice versa) and has checkboxes in case you want to sort by multiple columns at the same time
- FILTERING: has a text field for each column of the strategy where you can type logical expressions to filter the values
- TABLE: contains styling parameters
Many parameters have the "(i)" description marker, so hover over it to see more details.
Problems:
- The script works best on lower timeframes and continuous markets (trades 24/7), in other cases the backtesting results may vary from those that Tradingview shows
- The script shows closest results when Take Profit and Stop Loss are not used
- Max Runup percentage value is often wrong
Limitations:
- As we are limited by the maximum time a script can be running (which is 20s for Free plan and 40s for Paid plans), we can only backtest several hundreds of combinations within that timeframe (though it depends on the parameters, market and timeframe of the chart you use)

Index Strength Strategy with Signal Using the Index Strength Strategy Indicator for Trading
Introduction:
In this article, we'll explore the Index Strength Strategy Indicator and how it can be used for trading. The Index Strength Strategy Indicator is a technical analysis tool designed to help traders identify trends, determine trend strength, and generate buy and sell signals.
Overview of the Index Strength Strategy Indicator:
The Index Strength Strategy Indicator is based on two moving averages - a fast moving average and a slow moving average - and the Relative Strength Index (RSI). The fast and slow moving averages are used to determine the trend direction, while the RSI is used to calculate the trend strength. The indicator assigns a strength score to the current trend, which is then classified into one of four categories - Very Weak, Weak, Strong, or Very Strong. Traders can use this information to identify the strength of the trend and adjust their trading strategy accordingly.
The indicator also generates buy and sell signals based on a user-defined threshold level. When the strength score crosses above the threshold level, a buy signal is generated, and when the strength score crosses below the threshold level, a sell signal is generated.
Using the Index Strength Strategy Indicator for Trading:
Traders can use the Index Strength Strategy Indicator to identify trends, determine trend strength, and generate buy and sell signals. To use the indicator, traders should first determine the appropriate fast and slow moving average periods and the strength threshold level for their trading style. These input parameters can be adjusted in the indicator's settings.
Once the indicator is added to the chart, traders can use the strength score and trend direction to identify potential trading opportunities. If the trend is classified as Strong or Very Strong, traders may look for opportunities to enter long or short positions in the direction of the trend. If the trend is classified as Very Weak or Weak, traders may look for opportunities to exit or avoid positions.
Traders can also use the buy and sell signals generated by the indicator to enter or exit positions. When a buy signal is generated, traders can enter a long position, and when a sell signal is generated, traders can enter a short position. Traders should set stop-loss and take-profit levels based on their risk management strategy.
Avoiding Mistakes:
To avoid mistakes when using the Index Strength Strategy Indicator, traders should keep the following tips in mind:
Don't rely solely on the indicator - it should be used in conjunction with other technical analysis tools and fundamental analysis.
Use appropriate risk management strategies, including setting stop-loss and take-profit levels.
Adjust the input parameters of the indicator to match your trading style and preferences.
Avoid overtrading and chasing trades - wait for the right opportunities to enter or exit positions.
Trading Strategy Test Results: Time Frame Tested for 15 Mins
To provide an idea of the potential performance of the Index Strength Strategy Indicator, let's look at some recent test results for two popular indices - Bank Nifty and Nifty 50.
From 1-May-2023 to 12-May-2023, using 2 lots of Bank Nifty with the Index Strength Strategy Indicator, a profit of 15,175 was achieved, with a percentage profitable trade rate of 80% and a profit factor of 3.395. The maximum drawdown was 7,000, and the average trade was 3,035.
During the same time period, using 1 lot of Nifty 50 with the Index Strength Strategy Indicator, a profit of 8,187 was achieved
Conclusion:
The Index Strength Strategy Indicator is a useful tool for traders to identify trends, determine trend strength, and generate buy and sell signals. Traders can use the indicator in conjunction with other technical analysis tools and fundamental analysis to make informed trading decisions. By following proper risk management strategies and avoiding common mistakes, traders can use the indicator to improve their trading performance.

Kioseff Trading - AI-Powered Strategy Optimizer Introducing the Kioseff Trading AI-Powered Strategy Optimizer
Optimize and build your trading strategy with ease, no matter your experience level. The Kioseff Trading AI-Powered Strategy Optimizer allows traders to efficiently test and refine strategies with thousands of different profit targets and stop loss settings. Integrated with TradingView's backtester, this tool simplifies strategy optimization, strategy testing, and alert setting, enabling you to enhance your strategy with AI-driven insights.
Key Features:
Comprehensive Testing : Simultaneously test thousands of profit targets and stop losses to fine-tune your strategy.
Dual Strategy Optimization : Adjust and optimize both long and short strategies for balanced performance.
AI Integration : Elevate your strategy with heuristic-based adaptive learning, turning it into a smart, AI-assisted system.
Detailed Analysis : View critical metrics like profit factor, win rate, max drawdown, and equity curve, presented in a strategy script format.
Customizable Alerts : Set alerts for the best version of your strategy.
Flexible Risk Management : Optimize various stop loss types, including profit targets, limit orders, OCO orders, trailing stops, and fixed stops.
Targeted Goals : Choose optimization goals like highest win rate, maximum net profit, or most efficient profit.
Indicator Compatibility : Integrate any strategy/indicator, whether it’s your creation, a favorite author’s, or any public TradingView indicator.
Accessible Design : Navigate a user-friendly interface suitable for traders of all skill levels. No code required.
Precision Lock-In : “Lock” your optimal profit target or stop loss to drill down into precision testing of other variables.
How it works
It's important to remember that merely having the AI-Powered Strategy Optimizer on your chart doesn't automatically provide you with the best strategy. You need to follow the AI's guidance through an iterative process to discover the optimal settings for your strategy.
The Trading Strategy Optimizer is a versatile tool tailored for both non-coding traders and seasoned algorithmic trading professionals. Let's start with no-code-required instructions on how to use the optimizer.
Instructions: How To Optimize Your Strategy Without Code
1. Build your strategy in the settings
The image above shows explanations for each key setting.
Note: This example uses the RSI indicator to initiate a long trade whenever it dips below the 30 mark.
Ensure that the indicator you wish to optimize is already applied to your chart . This enables the Trading Strategy Optimizer to interact with the indicator and finetune profit targets and stop losses effectively.
Because the indicator is plotted on the chart I can access the indicator with the Trading Strategy Optimizer and optimize profit targets and stop losses for it.
2. Leverage AI Recommendations
Optimization Prompt: After you load your strategy, the tool advises you on new TP and SL levels that could be more profitable.
When your strategy is set, the tool gives you tips for where to set your profit goal (TP) and your stop loss to help you optimize your strategy. It'll tell you if there's a better range for these settings based on past results.
Follow Suggestions: Keep updating your TP and SL according to the tool's suggestions until it says "Best Found".
Final Result: The last image shows the best settings found by the indicator.
(Optional Step 3)
3. Lock the profit target or stop loss to further fine tune your strategy
Continue following the AI’s suggestion until “Best Found” is displayed.
Note: you can select lock either your stop loss or profit target for fine tuning. For this demonstration we will lock our profit target.
Code-Required Instructions (Optional)
You can backtest more code-intensive strategies, such as harmonic patterns, traditional chart patterns, candlestick patterns, Elliot wave, etc., by coding the entry condition in your own script and loading it into the Trading Strategy Optimizer. Let's dial in on how to achieve this!
1. You must create an integer variable in your script with an initial value of "0".
2. Define your entry condition in the code. Once complete, assign the value "1" to the variable you created if the entry condition is fulfilled.
3. Plot your variable.
4. Select the plotted variable in the settings for the Trading Strategy Optimizer
The image above shows a coded entry condition for the linear regression channel (which can be any indicator). When price crosses under and closes below the lower line our variable "strategyEntryVariable" is assigned the value "1".
The Trading Strategy Optimizer will treat this change in value from "0" to "1" as an entry signal and enter long/short up to 1000 times at the price where the entry condition was fulfilled.
5. Test Your Strategy
The image above shows the completion of the process! Keep applying the steps we described. Stick with the AI's recommendations until you see “Best Found” show up.
By following these instructions, you can build, test, and optimize almost any trading indicator or strategy!
So, just note that the Trading Strategy Optimizer considers a change in value of a plotted variable from "0" to "1" as an entry signal! So long as you follow this rule you should be able to test and optimize any conceivable, Pine Script compatible strategy!
AI Mode
AI Mode incorporates Heuristic-Based Adaptive Learning to fine-tune trading strategies in a continuous manner. This feature consists of two main components:
Heuristic-Based Decision Making: The algorithm evaluates multiple versions of your strategy using specific metrics such as Profit and Loss (PNL), Win Rate, and Most Efficient Profit. These metrics act as heuristics to assist the algorithm in identifying suitable profit targets and stop losses for trade execution.
Online Learning: The algorithm updates the performance evaluations of each strategy based on incoming market data. This enables the system to adapt to current market conditions.
Incorporating both heuristic-based decision-making and online learning, this feature aims to provide a framework for trading strategy optimization.
Settings
AI Mode Aggressiveness:
Description: The "AI Mode Aggressiveness" setting allows you to fine-tune the AI's trading behavior. This setting ranges from "Low" To "High, with higher aggressiveness indicating a more assertive trading approach.
Functionality: This feature filters trading strategies based on a proprietary evaluation method. A higher setting narrows down the strategies that the AI will consider, leaning towards more aggressive trading. Conversely, a lower setting allows for a more conservative approach by broadening the pool of potential strategies.
Adaptive Learning Aggressiveness:
Description: When Adaptive Learning is enabled, the "Adaptive Learning Aggressiveness" setting controls how dynamically the AI adapts to market conditions using selected performance metrics.
Functionality: This setting impacts the AI's responsiveness to shifts in strategy performance. By adjusting this setting, you can control how quickly the AI moves away from strategies that may have been historically successful but are currently underperforming, towards strategies that are showing current promise.
Additional Settings
Optimization
Trading system optimization is immensely advantageous when executed with prudence.
Technical-oriented, mechanical trading systems work when a valid correlation is methodical to the extent that an objective, precisely-defined ruleset can consistently exploit it. If no such correlation exists, or a technical-oriented system is erroneously designed to exploit an illusory correlation (absent predictive utility), the trading system will fail.
Evaluate results practically and test parameters rigorously after discovery. Simply mining the best-performing parameters and immediately trading them is unlikely a winning strategy. Put as much effort into testing strong-performing parameters and building an accompanying system as you would any other trading strategy. Automated optimization involves curve fitting - it's the responsibility of the trader to validate a replicable sequence or correlation and the trading system that exploits it.

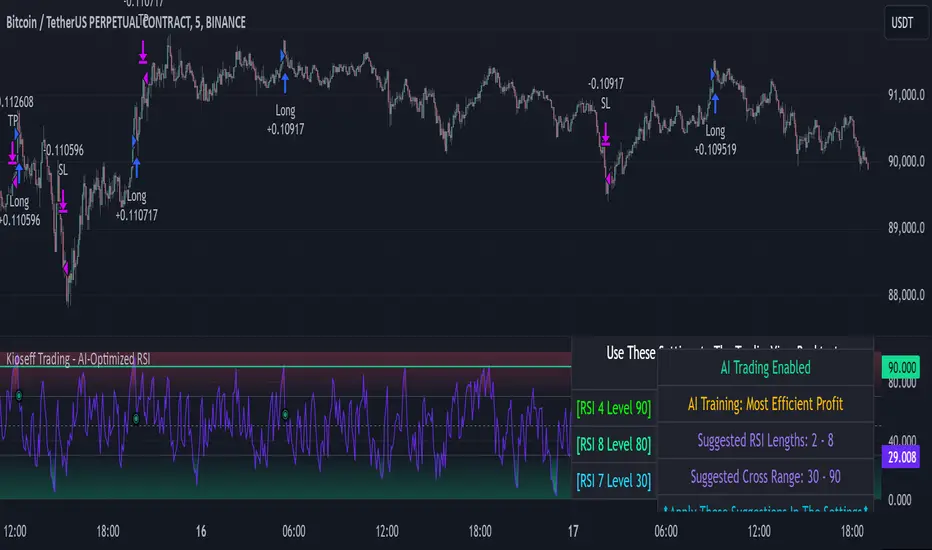
Kioseff Trading - AI-Optimized RSIAI-Optimized RSI
Introducing AI-Optimized RSI: a streamlined solution for traders of any skill level seeking to rapidly test and optimize RSI. Capable of analyzing thousands of strategies, this tool cuts through the complexity to identify the most profitable, reliable, or efficient approaches.
Paired with TradingView's native backtesting capabilities, the AI-Optimized RSI learns from historical performance data. Set up is easy for all skill levels, and it makes fine-tuning trading alerts and RSI straightforward.
Features
Purpose : Uncover optimal RSI settings and entry levels with precision. Say goodbye to random guesses and arbitrary indicator use—this tool provides clear direction based on data.
Target Performance : You set the goal, and AI-RSI seeks it out, whether it's maximizing profits, efficient trading, or achieving the highest win rate.
AI-Powered : With intelligent AI recommendations, the tool dynamically fine-tunes your RSI approach, steering you towards ideal strategy performance.
Rapid Testing : Evaluate thousands of RSI strategies.
Dual Direction : Perfect both long and short RSI strategies with equal finesse.
Deep Insights : Access detailed metrics including profit factor, PnL, win rate, trade counts, and more, all within a comprehensive strategy script.
Instant Alerts : Set alerts and trade.
Full Customization : Test and optimize all RSI settings, including cross levels, profit targets and stop losses.
Simulated Execution : Explore the impact of limit orders and other trade types through simulation.
Integrative Capability : Combine your own custom indicators or others from the TradingView community for a personalized optimization experience.
Flexible Timeframes : Set your optimization and backtesting to any date range.
Key Settings
The image above shows explanations for a list of key settings for the optimizer.
Direction : This setting controls trade direction: Long or Short.
Entry Condition : Define RSI entry: Select whether to trigger trades on RSI crossunders or crossovers.
RSI Lengths Range : Choose the range of RSI periods to test and find the best one.The AI will find the best RSI period for you.
RSI Cross Range : Set the range for RSI levels where crosses trigger trade signals. The AI will find the best level for you.
Combinations : Select how many RSI strategies to compare.
Optimization Type : Choose the goal for optimization and the AI: profit, win rate, or efficiency.
Profit Target : Set your profit target with this setting.
Stop Loss : Decide your maximum allowable loss (stop loss) per trade.
Limit Order : Specify whether to include limit orders in the strategy.
Stop Type : Choose your stop strategy: a fixed stop loss or a trailing stop.
How to: Find the best RSI for trading
It's important to remember that merely having the AI-Optimized RSI on your chart doesn't automatically provide you with the best strategy. You need to follow the AI's guidance through an iterative process to discover the optimal RSI settings and strategy.
1.Starting Your Strategy Setup
Begin by deciding your goals for each trade: your profit target and stop loss. You'll also choose how to manage your stops – whether they stay put (fixed) or move with the price (trailing), and whether you want to exit trades at a specific price (limit orders). Keep the initial settings for RSI lengths and cross ranges at their default to give the tool a broad testing field. The AI's guidance will refine these settings to pinpoint the most effective ones through a process of comprehensive testing.
The image above shows our chart prior to any optimization efforts.
Note: the settings shown above in the key settings section will be used to start our demonstration.
2. Follow AI’s suggestions
Optimization Prompt: After loading your strategy, the indicator will prompt you to change the RSI length range and RSI level range to a better performing range.
Continue changing the RSI length range and RSI level range to match the indicator's suggestions until "Best Found" is displayed!
The image above shows results after we applied the tool’s suggestions. New suggestions have appeared, and we will continue to apply them.
Continue to adjust settings as recommended by the optimizer. If no better options are found, the optimizer will suggest increasing the number of combinations. Repeat this process until the optimizer indicates that the optimal setting has been identified.
Success! With the "Best Found" notification, an optimized RSI is now active. The AI will keep refining the strategy based on ongoing performance, ensuring continuous optimization.
AI Mode
AI Mode incorporates Heuristic-Based Adaptive Learning to fine-tune trading strategies in a continuous manner. This feature consists of two main components:
Heuristic-Based Decision Making: The algorithm evaluates multiple RSI-based trading strategies using specific metrics such as Profit and Loss (PNL), Win Rate, and Most Efficient Profit. These metrics act as heuristics to assist the algorithm in identifying suitable strategies for trade execution.
Online Learning: The algorithm updates the performance evaluations of each strategy based on incoming market data. This enables the system to adapt to current market conditions.
Incorporating both heuristic-based decision-making and online learning, this feature aims to provide a framework for trading strategy optimization.
Settings
AI Mode Aggressiveness:
Description: The "AI Mode Aggressiveness" setting allows you to fine-tune the AI's trading behavior. This setting ranges from “Low” to “High”, with “High” indicating a more assertive trading approach.
Functionality: This feature filters trading strategies based on a proprietary evaluation method. A higher setting narrows down the strategies that the AI will consider, leaning towards more aggressive trading. Conversely, a lower setting allows for a more conservative approach by broadening the pool of potential strategies.
Adaptive Learning Aggressiveness:
Description: When Adaptive Learning is enabled, the "Adaptive Learning Aggressiveness" setting controls how dynamically the AI adapts to market conditions using selected performance metrics.
Functionality: This setting impacts the AI's responsiveness to shifts in strategy performance. By adjusting this setting, you can control how quickly the AI moves away from strategies that may have been historically successful but are currently underperforming, towards strategies that are showing current promise.
Optimization
Trading system optimization is immensely advantageous when executed with prudence.
Technical-oriented, mechanical trading systems work when a valid correlation is methodical to the extent that an objective, precisely-defined ruleset can consistently exploit it. If no such correlation exists, or a technical-oriented system is erroneously designed to exploit an illusory correlation (absent predictive utility), the trading system will fail.
Evaluate results practically and test parameters rigorously after discovery. Simply mining the best-performing parameters and immediately trading them is unlikely a winning strategy. Put as much effort into testing strong-performing parameters and building an accompanying system as you would any other trading strategy. Automated optimization involves curve fitting - it's the responsibility of the trader to validate a replicable sequence or correlation and the trading system that exploits it.
MACD Optimizer Pro [Kioseff Trading]Massive update! This script now includes 12 different moving averages and 30+ built-in technical indicators to enhance your trading strategy optimization! (:
This script (MACD Optimizer Pro) allows the user to optimize and test hundreds of MACD strategies, simultaneously, in under 40 seconds. Of course, theoretically, an unlimited number of trading strategies can be tested with the MACD Optimizer Pro. After the optimization period - the MACD Optimizer Pro will show the most profitable MACD strategy or, should you choose, the highest win-rate MACD strategy or the most-efficient MACD strategy!
Optimization results can be backtested and verified using the native TradingView backtester - which is included in the MACD Optimizer Pro - and made easy to use! This feature makes settings alerts a simple practice!
Features
Test hundreds of MACD strategies, simultaneously, in under 40 seconds.
Optimize long MACD strategies and short MACD strategies.
12 different built-in moving averages included to improve your MACD strategy.
30+ built-in technical indicators to improve your MACD strategy.
Runs as a strategy script - profit factor, PnL , win-rate, number of trades, max drawdown, equity curve and other pertinent statistics shown.
Alerts
Optimize any MACD setting
Profit targets, trailing stops, fixed stop losses, and a binary MACD strategy can all be tested.
Strategies can be optimized for highest win rate, highest net profit, most efficient profit.
Limit orders can be simulated.
External indicators can be used for optimization i.e. your own, custom-built indicator, an indicator from your favorite author, or almost any publicly available
TradingView indicator.
Date range for optimization and backtesting are configurable.
Explanation
The image above shows a list of configurations for the optimizer. You can
You can test hundreds of different MACD settings in under 40 seconds on any timeframe, asset, etc.
The image above shows additional settings to filter the outcome of your optimization testing. Additionally, you can test an unlimited number of profit targets and stop losses!
You can add one of several built-in TradingView indicators to filter trade entries.
The image above shows all built-in moving averages and TradingView indicators that can be incorporated into your MACD strategy.
Additionally, you can add your own, custom indicator to the optimization test, your favorite indicator by your favorite author or almost any publicly available indicator on TradingView.
The image above shows the settings section in which you can implement this feature.
The image above shows an example of the custom indicator feature! In this instance, I am using the public indicator titled "Self-Optimizing" RSI and requiring it to measure below a level prior to entry! Almost any custom indicator, your favorite indicator, etc. is compatible with this feature!
The MACD Optimizer has improved user friendliness over previous versions. The optimizer can be as simple or complex as you'd like - capable of handling both "easy" and "difficult" tasks at your discretion.
Additionally, you can configure the optimizer to prioritize MACD strategies that earn profit most efficiently!
The image above shows this feature in action.
You can also configure the optimizer to prioritize MACD strategies that achieve the highest win rate!
The image above shows this feature in action.
Instructions
The instructions below show a rudimentary approach to using the optimizer.
1. Build your strategy in the settings.
You should also disable the "Run a Backtest" feature to improve load times during optimization.
The image above shows my custom strategy settings.
Now that you've got some data on your chart - you should try "Freezing" the "Smoothing" setting for MACD . When doing this, the optimizer will test hundreds of MACD settings with a fixed "Smoothing" setting. Try using the best "Smoothing" setting you were able to find for your initial testing.
2. Take the best "Smoothing" setting and test various MACD and Signal Lengths.
The image above shows me configuring the MACD Optimizer to test different MACD line lengths and Signal line lengths with a fixed "smoothing" setting.
From the results, we can see that there are better MACD settings than what was shown in our initial test!
With this information we can execute a TradingView backtest.
3. Execute a TradingView Backtest.
You must enable the "Run a Backtest" feature to perform a TradingView backtest. Additionally, it's advised to enable the "STOP OPTIMIZATION" feature when performing a TradingView backtest. Enabling this feature will improve load times for the backtest to only a few seconds (since the optimizer won't look for the best setting when this feature is enabled).
The image above shows completion of the process!
From here, you can perform further testing, set alerts, etc.
Backtest Settings Shown
Initial Capital: The initial capital used for the shown backtests is $3,500 USD. Set the initial capital to replicate your true starting capital (: PnL for the MACD strategies (listed in table) is calculated using a starting capital of $10,000 USD.
Slippage: The slippage settings for the displayed backtest was set to 2 ticks.
Commission: Commission was adjusted to 0.1%.
Verify Price for Limit Orders was set to 2 ticks.
Optimization
Trading system optimization is immensely advantageous when executed with prudence.
Technical-oriented, mechanical trading systems work when a valid correlation is methodical to the extent that an objective, precisely-defined ruleset can consistently exploit it. If no such correlation exists, or a technical-oriented system is erroneously designed to exploit an illusory correlation (absent predictive utility), the trading system will fail.
Evaluate results practically and test parameters rigorously after discovery. Simply mining the best-performing parameters and immediately trading them is unlikely a winning strategy. Put as much effort into testing strong-performing parameters and building an accompanying system as you would any other trading strategy. Automated optimization involves curve fitting - it's the responsibility of the trader to validate a replicable sequence or correlation and the trading system that exploits it.
Thanks for checking this out!

[SPOILED]SuperTrench - ETH Super ScalperHi Traders,
I'm republishing this script as I finally polished it to perfection IMO. The script uses 5 coding sections: entry, trend filter, pivot filter, take profit, and stop loss. The script mainly uses trailing as take profit; this is probably the easiest way to make a profitable scalper strategy.
Backtest capital is set to 1000 USDT, 35% equity, 0.04% commission, limited backtest date from Jan 2022 to now, backtested on ETH/USDT prep contracts 15m timeframe, result as shown below.
It looks unreal right? Hell no, I actually tested this strategy on Binance from Dec 06 to Dec 10. I got 8.29% return with 4x leverage, 50% equity setup; 75% win rate,1.58 profit factor, with 4.3% max drawdown, it is amazingly close to the backtest result.
User Manual
Entry >>> Stoch RSI:
I added 5 MA types to the Stoch RSI which is HMA/VWMA/WMA/EMA/SMA, HMA with Length setting of 5, 8 seems to be most efficient, VWMA and WMA with 8, 13 will generate less entry signals but with less entry risks.
Entry >>> R Style:
It based on price action, with candlestick makes a U turn, after 2nd candlestick confirmed, it generates entry signal, this will give you some extra entries, better leave it enabled.
Entry >>> Price Step:
This probably is the core feature of this strategy; also my secret ingredient to making this strategy this efficient. It is recommended to enable step 1-5, more steps basically means more entries, but they are not necessarily profitable.
Trend Filter >>> Price Step:
I couldn't tell you much details about how this indicator works, but it is a reliable indicator, based on price action, and I got some ideas from Demark9 indicator. The bigger the level, the stronger the filter is, please note that if 'Price Step Entries' less than Price Step Trend, entries will be ignored.
Pivot Filter >>> RSI Pivot & Pinbar Pivot:
RSI Pivot detects if the RSI signal line making U turn in certain condition, Pinbar detection combines R Style entry when price action U turn took place, these 2 pivot filter will close the trade once it is counter trend, so it better enable and leave it as is.
Trend Filter >>> Trend Magic:
Trend Magic uses CCI and ATR to calculate trend status, green means uptrend, red means downtrend, pretty straight forward, the best value for this indicator would be, 21, 34, 55, 89.
Trend Filter >>> Alpha:
This filter combines R style pivot, price step, EMA all together to detects consolidation area, because EMA was involved, so the best look back period would be around 15-35, it is best to use default value IMO, in another hands, if you need stronger filter, feel free to use 10, 18, 20, 25, 30, 35, make sure look back period should increase or decrease by 5 every time.
Take Profit and Stop Loss:
The default value for tp is set to 0.4%, but I also give you option to switch to ATR TP; you can adjust in the ATR multiplier, default ATR trailing stop loss uses 1 ATR, but you can adjust it for better drawdown tolerance. Fixed ATR SL is also given when fixed ATR is enabled. There will be a failsafe SL default set to 1% if price moves counter direction of opened position, it will close trade no matter what happens.
Enjoy :)

Strategy Myth-Busting #20 - HalfTrend+HullButterfly - [MYN]#20 on the Myth-Busting bench, we are automating the " I Found Super Easy 1 Minute Scalping System And Backtest It 100 Times " strategy from " Jessy Trading " who claims 30.58% net profit over 100 trades in a couple of weeks with a 51% win rate and profit factor of 1.56 on EURUSD .
This one surprised us quite a bit. Despite the title of this strategy indicating this is on the 1 min timeframe, the author demonstrates the backtesting manually on the 5 minute timeframe. Given the simplicity of this strategy only incorporating a couple of indicators, it's robustness being able to be profitable in both low and high timeframes and on multiple symbols was quite refreshing.
The 3 settings which we need to pay most attention to here is the Hull Butterfly length, HalfTrend amplitude and the Max Number Of Bars Between Hull and HalfTrend Trigger. Depending on the timeframe and symbol, these settings greatly impact the performance outcomes of the strategy. I've listed a couple of these below.
And as always, If you know of or have a strategy you want to see myth-busted or just have an idea for one, please feel free to message me.
This strategy uses a combination of 3 open-source public indicators:
Hull Butterfly Oscillator by LuxAlgo
HalfTrend by Everget
Trading Rules
5 min candles but higher / lower candles work too.
Stop loss at swing high/low
Take Profit 1.5x the risk
Long
Hull Butterfly gives us green column, Wait for HalfTrend to present an up arrow and enter trade.
Short
Hull Butterfly gives us a red column , Wait for HalfTrend to present a down arrow and enter trade.
Alternative Trading Settings for different time frames
1 Minute Timeframe
Move the Hull Butterfly length from the default 11 to 9
Move the HalfTrend Amplitude from the default 2 to 1
Enabling ADX Filter with a 25 threshold
2 Hour Timeframe
Move the HalfTrend Amplitude from the default 2 to 1
Laddered Take Profits from 14.5% to 19% with an 8% SL

LuxAlgo - Backtester (S&O)The S&O Backtester is an innovative strategy script that encompasses features + optimization methods from our Signals & Overlays™ toolkit and combines them into one easy-to-use script for backtesting the most detailed trading strategies possible.
Our Signals & Overlays™ toolkit is notorious for its signal optimization methods such as the 'Optimal Sensitivity' displayed in its dashboard which provides optimization backtesting of the Sensitivity parameter for the Confirmation & Contrarian Signals.
This strategy script allows even more detailed & precise backtests than anything available previously in the Signals & Overlays™ toolkit; including External Source inputs allowing users to use any indicator including our other paid toolkits for take profit & stop loss customization to develop strategies, along with 10+ pre-built filters directly Signals & Overlays™' features.
🔶 Features
Full Sensitivity optimization within the dashboard to find the Best Win rates or Best Profits.
Counter Trade Mode to reverse signals in undesirable market conditions (may introduce higher drawdowns)
Built-in filters for Confirmation Signals w/ Indicator Overlays from Signals & Overlays™.
Built-in Confirmation exit points are available within the settings & on by default.
External Source Input to filter signals or set custom Take Profits & Stop Losses.
Optimization Matrix dashboard option showing all possible permutations of Sensitivity.
Option to Maximize for Winrate or Best Profit.
🔶 Settings
Sensitivity signal optimizations for the Confirmation Signals algorithm
Buy & Sell conditions filters with Indicator Overlays & External Source
Take Profit exit signals option
External Source for Take Profit & Stop Loss
Sensitivity ranges
Backtest window default at 2,000 bars
External source
Dashboard locations
🔶 Usage
Backtests are not necessarily indicative of future results, although a trader may want to use a strategy script to have a deeper understanding of how their strategy responds to varying market conditions, or to use as a tool for identifying possible flaws in a strategy that could potentially be indicative of good or bad performance in the future.
A strategy script can also be useful in terms of it's ability to generate more complete & configurable alerts, giving users the option to integrate with external processes.
In the chart below we are using default settings and built-in optimization parameters to generate the highest win rate.
Results like the above will vary & finding a strategy with a high win rate does not necessarily mean it will persist into the future, however, some indications of a well-optimized strategy are:
A high number of closed trades (100+) with a consistently green equity curve
An equity curve that outperforms buy & hold
A low % max drawdown compared to the Net Profit %.
Profit factor around 1.5 or above
In the chart below we are using the Trend Catcher feature from Signals & Overlays™ as a filter for standard Confirmation Signals + exits on a higher timeframe.
By filtering bullish signals only when the Trend Catcher is bullish, as well as bearish signals for when the Trend Catcher is bearish, we have a highly profitable strategy created directly from our flagship features.
While the Signals & Overlays features being used as built-in filters can generate interesting backtests, the provided External Sources can allow for even more creativity when creating strategies. This feature allows you to use many indicators from TradingView as filters or to trigger take-profit/stop-loss events, even if they aren't from LuxAlgo.
The chart below shows the HyperWave Oscillator from our Oscillator Matrix™ being used for take-profit exit conditions, exiting a long position on a profit when crossing 80, and exiting a short position when crossing 20.
🔶 Counter Trade Mode
Our thesis has always firmly remained to use Confirmation Signals within Signals & Overlays™ as a supportive tool to find trends & use as extra confirmation within strategies.
We included the counter-trade mode as a logical way to use the Confirmation signals as direct entries for longs & shorts within more contrarian trading strategies. Many traders can relate to using a trend-following indicator and having the market not respect its conditions for entries.
This mode directly benefits a trader who is aware that market conditions are generally not-so-perfect trends all the time. Acknowledging this, allows the user to use this to their advantage by introducing countertrend following conditions as direct entries, which tend to perform very well in ranging markets.
The big downfall of using counter-trade mode is the potential for very large max-drawdowns during trending market conditions. We suggest for making a strategy to consider introducing stop-loss conditions that can efficiently minimize max-drawdowns during the process of backtesting your creations.
Sensitivity Optimization
Within the Signals & Overlays™ toolkit, we allow users to adjust the Confirmation Signals with a Sensitivity parameter.
We believe the Sensitivity paramter is the most realistic way to generate the most actionable Confirmation Signals that can navigate various market conditions, and the Confirmation Signals algorithm was designed specifically with this in mind.
This script takes this parameter and backtests it internally to generate the most profitable value to display on the dashboard located in the top right of the chart, as well as an optimization table if users enable it to visualize it's backtesting.
In the image below, we can see the optimization table showing permutations of settings within the user-selected Sensitivity range.
The suggested best setting is given at the current time for the backtesting window that's customizable within the indicator. Optimized settings for technical indicators are not indicative of future results and the best settings are highly likely / guaranteed to change over time.
Optimizing signal settings has become a popular activity amongst technical analysts, however, the real-time beneficial applications of optimizing settings are limited & best described as complicated (even with forward testing).
🔶 Strategy Properties (Important)
We strongly recommend all users to ensure they adjust the Properties within the script settings to be in line with their accounts & trading platforms of choice to ensure results from strategies built are realistic.
🔶 How to access
You can see the Author's Instructions below to learn how to get access on our website.

Trend Follower Intraday [ Adjustable TF ]Trend Follower Intraday for 3 minute Time-Frame (Adjustable) , that has the time condition for Indian Markets as well.
Unlike the Free Scripts - Risk Management , Position Sizing , Partial Exit etc. are also included .
Send us a Message to know more about the strategy.
// ══════════════════════════════════════════════════════════════════════════ //
The Timing can be changed to fit other markets, scroll down to "TIME CONDITION" to know more.
The commission is also included in the strategy .
The basic idea is when ,
1) EMA1 crosses above EMA2 , is a Long condition .
2) EMA1 crosses below EMA2 , is a Short condition .
3) Green Section indicates Long position.
4) Red Section indicates Short position.
5) Allowed hours specifies the trade entry timing.
6) ATR STOP is the stop-loss value on chart , can be adjusted in INPUTS.
7) Target 1 is the 1st target value on chart , can be adjusted in INPUTS.
8) RISK is Maximum Risk per trade for the intraday trade can be changed .
9) Total Capital used can be adjusted under INPUTS.
10) ATR TRAIL is used for trailing after entry, as mentioned in the inputs below.
11) Check trades under the list of trades .
12) Trade only in liquid stocks .
13) Risk only 1-5% of total capital.
14) Inputs can be changed for better back-test results, but also manually check the trades before setting alerts
15) SQUARE OFF TIME - As you change the time frame , also change the square-off time to the candle's closing time.
Eg: For 3min Time-frame , Hour = 2Hrs | Minute = 57min
16) Strategy stops for the day if you have a loss .
17) COMMISSION value is set to 20Rs and SLIPPAGE value is set to 2 . Go to properties to change it .
*The input values and the results are mentioned under "BACKTEST RESULTS" below*
// ══════════════════════════════ //
// ————————> RISK MANAGEMENT <——————— //
// ══════════════════════════════ //
Risk management is done based on max loss per trade and can be adjusted in the INPUTS.
// ═══════════════════════════ //
// ————————> POSITION SIZE <——————— //
// ═══════════════════════════ //
Quantity of each trade is different based on the loss
// ═════════════════════════ //
// ————————> PROPERTIES <——————— //
// ═════════════════════════ //
COMMISSION , SLIPPAGE ,RECALCULATE is already mentioned in the code.
COMMISSION can be charges , based on the broker charges.
// ═══════════════════════════════//
// ————————> TIME CONDITION <————————— //
// ═══════════════════════════════//
The time can be changed in the INPUT.
The Indian Markets open at 9:15am and closes at 3:30pm.
The 'Allowed hours' under Inputs specifies the time at which Entries should happen .
"Close All" function closes all the trades before 3pm , at the open of the next candle.
To change the time to close all trades , check INPUT.
All open trades get closed by 3pm , because some brokers don't allow you to place fresh intraday orders after 3pm .
// ═══════════════════════════════════════════════ //
// ————————> BACKTEST RESULTS ( 123 CLOSED TRADES ) <————————— //
// ═══════════════════════════════════════════════ //
INPUTS can be changed for better Back-Test results.
The strategy applied to NSE:JSWENERGY (3 min Time-Frame and with a capital of 3,00,000 ) gives us 81% profitability , as shown below
It was tested for a period a 6 months with a Profit Factor of 1.957 ,net Profit of 43,000Rs .
Sharpe Ratio = 0.745
Sortino Ratio = 2.091
No strategy in the world promises 100% profits in all market conditions , so always define your risk before trading.
Also check Back-Test results manually ,before setting Alerts
The Graph has a Linear Curve with Consistent Profits.
The INPUTS are as follows,
1) EMA1 ————————————————> 38
2) EMA2 ————————————————> 118
3) ALLOWED HRS ———————————> 9:35 TO 14:30
4) ATR STOP ——————————————> 3.2
5) RISK ——————————————————> 3000
6) ATR TRAIL ———————————————> 2.6
7) TARGET 1 ————————————————> 2.4
8) MAX POSITION VALUE ——————————> 3,00,000
8) MAX DRAWDOWN —————————————> 9,000
8) SQUARE-OFF ————————————————> 14:57
NSE:JSWENERGY
Apply it to your charts Now !
NSE:JSWENERGY
Send us a message for FREE TRIALS | Instant Access
Thank You ☺

SUPPORT RESISTANCE STRATEGY [5MIN TF]A SUPPORT RESISTANCE BREAKOUT STRATEGY for 5 minute Time-Frame , that has the time condition for Indian Markets
The Timing can be changed to fit other markets, scroll down to "TIME CONDITION" to know more.
The commission is also included in the strategy .
The basic idea is when ,
1) Price crosses above Resistance Level ,indicated by Red Line, is a Long condition.
2) Price crosses below Support Level ,indicated by Green Line , is a Short condition.
3) Candle high crosses above ema1, is a part of the Long condition .
4) Candle low crosses below ema1, is a part of the Short condition .
5) Volume Threshold is an added confirmation for long/short positions.
6) Maximum Risk per trade for the intraday trade can be changed .
7) Default qty size is set to 50 contracts , which can be changed under settings → properties → order size.
8) ATR is used for trailing after entry, as mentioned in the inputs below.
// ═════════════════════════//
// ————————> INPUTS <————————— //
// ═════════════════════════//
→ L_Bars ———————————> Length of Resistance / Support Levels.
→ R_Bars ———————————> Length of Resistance / Support Levels.
→ Volume Break ———————> Volume Breakout from range to confirm Long/Short position.
→ Price Cross Ema —————> Added condition as explained above (3) and (4).
→ ATR LONG —————————> ATR stoploss trail for Long positions.
→ ATR SHORT ————————> ATR stoploss trail for Short positions.
→ RISK ————————————> Maximum Risk per trade intraday.
The strategy was back-tested on TCS ,the input values and the results are mentioned under "BACKTEST RESULTS" below.
// ═════════════════════════ //
// ————————> PROPERTIES<——————— //
// ═════════════════════════ //
Default_qty_size ————> 50 contracts , which can be changed under
Settings
↓
Properties
↓
Order size
// ═══════════════════════════════//
// ————————> TIME CONDITION <————————— //
// ═══════════════════════════════//
The time can be changed in the script , Add it → click on ' { } ' → Pine editor→ making it a copy [right top corner} → Edit the line 27.
The Indian Markets open at 9:15am and closes at 3:30pm.
The 'time_cond' specifies the time at which Entries should happen .
"Close All" function closes all the trades at 3pm , at the open of the next candle.
To change the time to close all trades , Go to Pine Editor → Edit the line 92 .
All open trades get closed at 3pm , because some brokers don't allow you to place fresh intraday orders after 3pm .
// ═══════════════════════════════════════════════ //
// ————————> BACKTEST RESULTS ( 100 CLOSED TRADES )<————————— //
// ═══════════════════════════════════════════════ //
INPUTS can be changed for better Back-Test results.
The strategy applied to NSE:TCS ( 5 min Time-Frame and contract size 50) gives us 60% profitability , as shown below
It was tested for a period a 6 months with a Profit Factor of 1.8 ,net Profit of 30,000 Rs profit .
Sharpe Ratio : 0.49
Sortino Ratio : 1.4
The graph has a Linear Curve with Consistent Profits.
The INPUTS are as follows,
1) L_Bars —————————> 4
2) R_Bars —————————> 4
3) Volume Break ————> 5
4) Price Cross Ema ——> 100
5) ATR LONG ——————> 2.4
6) ATR SHORT —————> 2.6
7) RISK —————————> 2000
8) Default qty size ——> 50
NSE:TCS
Save it to favorites.
Apply it to your charts Now !!
Thank You ☺ NSE:TCS

PIVOT STRATEGY [INDIAN MARKET TIMING]
A Back-tested Profitable Strategy for Free!!
A PIVOT INTRADAY STRATEGY for 5 minute Time-Frame , that also explains the time condition for Indian Markets
The Timing can be changed to fit other markets, scroll down to "TIME CONDITION" to know more.
The commission is also included in the strategy .
The basic idea is when ,
1) Price crosses above ema1 ,indicated by pivot highest line in green color .
2) Price crosses below ema1 ,indicated by pivot lowest line in red color .
3) Candle high crosses above pivot highest , is the Long condition .
4) Candle low crosses below pivot lowest , is the Short condition .
5) Maximum Risk per trade for the intraday trade can be changed .
6) Default_qty_size is set to 60 contracts , which can be changed under settings → properties → order size .
7) ATR is used for trailing after entry, as mentioned in the inputs below.
// ═════════════════════════//
// ————————> INPUTS <————————— //
// ═════════════════════════//
Leftbars —————> Length of pivot highs and lows
Rightbars —————> Length of pivot highs and lows
Price Cross Ema —————> Added condition
ATR LONG —————> ATR stoploss trail for Long positions
ATR SHORT —————> ATR stoploss trail for Short positions
RISK —————> Maximum Risk per trade for the day
The strategy was back-tested on RELIANCE ,the input values and the results are mentioned under "BACKTEST RESULTS" below .
// ═════════════════════════ //
// ————————> PROPERTIES<——————— //
// ═════════════════════════ //
Default_qty_size ————> 60 contracts , which can be changed under settings
↓
properties
↓
order size
// ═══════════════════════════════//
// ————————> TIME CONDITION <————————— //
// ═══════════════════════════════//
The time can be changed in the script , Add it → click on ' { } ' → Pine editor→ making it a copy [right top corner} → Edit the line 25 .
The Indian Markets open at 9:15am and closes at 3:30pm .
The 'time_cond' specifies the time at which Entries should happen .
"Close All" function closes all the trades at 3pm, at the open of the next candle.
To change the time to close all trades , Go to Pine Editor → Edit the line 103 .
All open trades get closed at 3pm , because some brokers don't allow you to place fresh intraday orders after 3pm .
NSE:RELIANCE
// ═══════════════════════════════════════════════ //
// ————————> BACKTEST RESULTS ( 128 CLOSED TRADES )<————————— //
// ═══════════════════════════════════════════════ //
INPUTS can be changed for better back-test results.
The strategy applied to NIFTY ( 5 min Time-Frame and contract size 60 ) gives us 60% profitability y , as shown below
It was tested for a period a 6 months with a Profit Factor of 1.45 ,net Profit of 21,500Rs profit .
Sharpe Ratio : 0.311
Sortino Ratio : 0.727
The graph has a Linear Curve with consistent profits .
The INPUTS are as follows,
1) Leftbars ————————> 3
2) Rightbars ————————> 5
3) Price Cross Ema ——————> 150
4) ATR LONG ————————> 2.7
5) ATR SHORT ———————> 2.9
6) RISK —————————> 2500
7) Default qty size ——————> 60
NSE:RELIANCE
Save it to favorites.
Apply it to your charts Now !!
↓
FOLLOW US FOR MORE !
Thank me later ;)

[Pt] TICK Supertrend Strategy, 5 minBackground:
It is well known that the indices such as SPY and QQQ follow/represent market sentiment. The TICK index literally represents the market sentiment as it compares the number of stocks that are rising and falling on the NYSE. By default, the TICK index is a short term indicator. Therefore it isn't reliable for swing trading or long term strategies. However, it is perfect for scalping.
Although TICK is well known, many does not know how to use it effectively. As part of the background mechanism of this script, I’ve divided TICK into 5 major zones based on the close of each candle: Overbought (neutral with bearish bias), Bullish, Neutral, Bearish, and Oversold (neutral with bullish bias). Along with the use of Heikin Ashi technique, RSI, moving averages and candle analysis, this strategy aims to provide accurate representation of market sentiment and profitable entry and exit points. *** At the time of publication, this strategy has proved to be consistently profitable. HOWEVER, this DOES NOT guarantee future profitability. So use at your own risk! ***
What is it showing?
This strategy is an intraday scalping strategy that uses TICK data to predict market directions for optimal entry and exit points. It is displayed similarly to the famous Supertrend indicator, which is one of the most common ATR based trailing stop indicators, so visually it is easy to read. This strategy is suitable for trading indices such as SPX , SPY , SPX500USD , QQQ , DJI and any other tickers that have high positive correlation with TICK.
Script is proprietary, but as mentioned it incorporates the following elements with additional candlestick analysis, pattern recognition, stop-loss and profit taking strategy:
- NYSE TICK data
- Heikin Ashi candle technique
- ATR
- RSI
- Moving Averages
Bullish trend is determined by a confluence of said indicators and analyses, and is displayed as a green line under the price action. The distance is defined by an adjustable value that is based on a percentage of the previous daily ATR value. When a long order is in play, that line also acts as the stop-loss level. Bearish trend is the opposite and is displayed in red, by default.
What's unique?
Detecting a ranging market structure and avoiding overtrading in a choppy market has always proven to be difficult, even for the most professional traders. This strategy has built-in “choppiness” and volatility filtering scripts that attempts to help reduce the number of false entries. These elements are what makes this strategy unique and different from other indictors mashup strategies.
In addition, this strategy takes previous trades into account and “learn” from past trades when determining the optimal stop-loss level to maximize profitability. This allows this strategy to better adapts to changing and evolving market conditions.
Strategy statistics
All parameters are designed for 5min time frame.
At the time of publication, this strategy has proved to be consistently profitable through limited back testing data.
Initial capital = $10000
Pyramiding = 1
Slippage = 3 ticks to account for spread
Default leverage shown = 9x
Quantity per trade = 100% of account
Back testing period at time of publication = Apr 11, 2022 - July 22, 2022
Trading Session = 1000 - 1530 Mon-Fri
Timeframe = 5 min
Gain = 1338.48%
Total trades = 253
% Profitable = 45.85%
Profit Factor = 2.506
Max Drawdown = 19.36%
Extras
This release includes default AutoView alerts for trading SPX500USD on Oanda. It includes both long and short order entry alerts, and trailing stop-loss alerts.
Please DM for free trial.
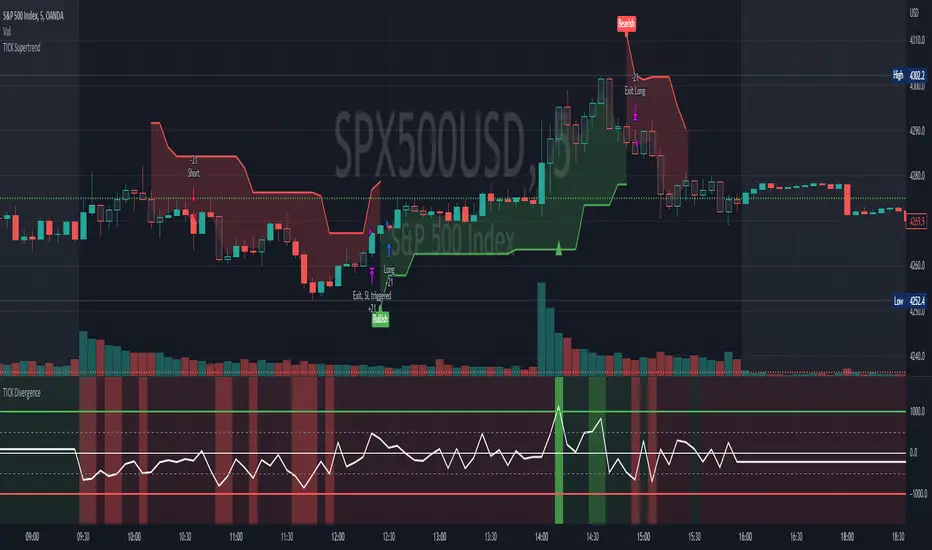
Smart Money - Oscillator and Volume StrategyOverview
This is a no-repaint strategy that is highly optimized for BINANCE:ETHUSDTPERP 30m, normal candles. It is a long/short strategy that is based on CMF, ADX/DMI, Keltner Channels, and other oscillators to identify smart money.
The overall idea of the strategy is to effectively capture the beginnings and ends of trends in price action, and go long/short accordingly. To achieve this, potential entry points are identified with various oscillators and these are then filtered using a variety of moving averages and strength/momentum indicators.
Short and sell inflections are found when ADX, DMI, and/or CMF oscillate below a specified threshold, and Keltner Channels are also used to indicate potential trades.
The indicator will continue to be updated and optimized for current and future market conditions.
If purchased, access to the indicator will be available within 24 hours.
Backtest Results
Parameters:
- 2021-01-01 to present (19 months)
- 100% equity order size
- 0.04% commission fees
- No leverage
17,089% net profit through 296 trades with 60.47% of trades being profitable.
Profit factor of 2.862, Sharpe Ratio of 1.158
Parameters:
- 2021-01-01 to present (19 months)
- $1,000 initial capital
- $1,000 order size
- 0.04% commission fees
- No leverage
584% net profit through 296 trades with 60.47% of trades being profitable.
Parameters:
- 2021-01-01 to present (19 months)
- 500% equity order size
- 0.04% commission fees
- 5x leverage
8,587,557% net profit through 299 trades with 59.87% of trades being profitable.
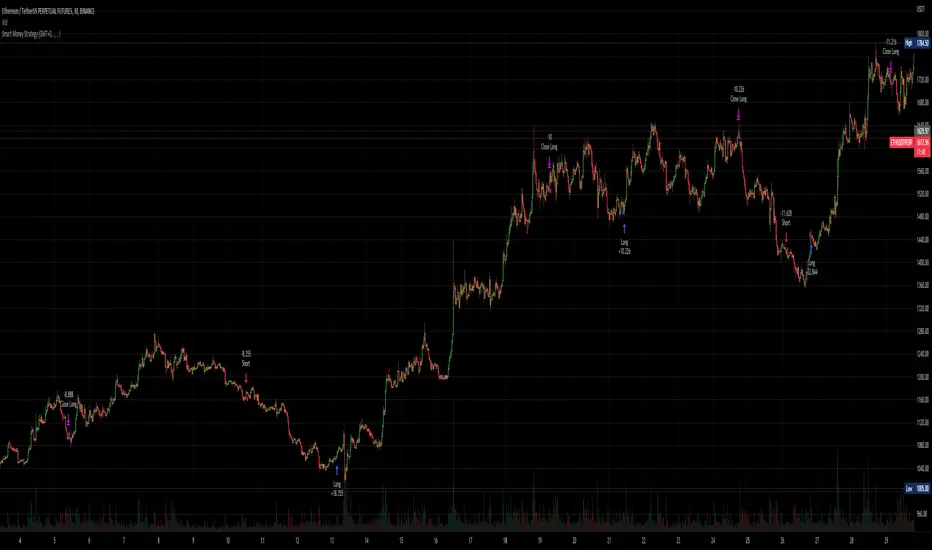
Self-Optimizing RSI Strategy [Kioseff Trading]Hello!
Introducing the Self-Optimizing RSI Strategy.
The indicator tests up to 800 RSI strategies simultaneously, looping through arrays, and auto plots the best performing parameter set.
The image above shows the result of 800 RSI strategies concurrently.
The table oriented bottom right shows the performance and risk metrics of the best performing RSI system tested across the bar set. Additionally, the conditions for entry and exit are displayed; for the image - a long entry system predicated on RSI crossunders and exit system predicated on a 1% TP and 2% SL are shown.
The indicator calculates numerous risk and performance metrics.
Calculated metrics include:
RSI Parameters
RSI Cross Entry Level
Total Trades
Win Rate
Avg. Gain for Winning Trades
Max Pain
PnL (Cumulative Performance)
Profit Factor
Avg. Loss for Losing Trades
Ratio Avg. Win / Avg. Loss
Avg. Bars in Trade
Max Drawdown
Current Drawdown
Open Position PnL
"Dynamic" indicates the performance of self-optimizing RSI system was tested.
The image above shows the performance of the greatest-performing RSI system - a fixed set of parameters - when adhering to a 1% TP and 2% fixed SL.
Trailing Stops and Profit-Taking Limit orders can be set/simulated.
The image above shows a dynamic entry level - plotted as a purple, non-transparent line.
The entry level "self-optimizes" to mimic the best performing RSI system at current time.
The image above exemplifies the functionality for all horizontal lines plotted on the chart.
The average RSI level achieved subsequent a profitable trade is shown.
The average RSI level achieved subsequent a losing trade is shown.
The entry level for RSI crossunders/crossovers is shown.
The image above show the Self-Optimizing RSI indicator recording entries & exits; gains & losses, for each executed trade.
You can "verify" trades manually.
Blue boxes reflect an entered position.
Green boxes reflect a closed, profitable trade.
Red boxes reflect a close, losing trade.
The percentage gain for a profitable trade is appended to green boxes; the percentage loss for a losing trade is appended to red boxes.
The Self-Optimizing RSI indicator plots off the chart; however, percentage gains/losses are measured against price, not RSI.
Boxes correlate to the interval a trade was entered/exited on.
The indicator hosts various methods to filter the outcome for testing.
For instance, you can:
Use trailing stops or fixed stop losses
Test RSI crossunders and crossovers
Configure the RSI settings that are tested (i.e. RSI 2 - 9, RSI 14 - 20, RSI 50 - 57)
Test short-based RSI Systems and long-based RSI systems
Simulate limit orders (Exit intrabar at fixed stop losses or trailing stop losses; exit intrabar at profit targets)
Require all tested RSIs to trend above or below their respective average (i.e. all RSIs must trend above/below their 50-interval EMA values. SMAs can also be used)
Use external indicators and require a user-defined value be exceeded, measured below, or that price exceed or measure below an indicator. The Self-Optimizing RSI indicator incorporates a few built-in technical indicators - ADX, %k, MFI, CMFI, and RSI. Consequently, you can require these indicators to measure above/below a specified level prior to entry. Additionally, you can supplement an extrinsic indicator (anything custom coded with plot values) to the entry logic for the Self-Optimizing RSI indicator. I'll show an example shortly.
Adjust the time window that's tested.
Adjust PT and SL percentages.
Override plot an RSI system to procure thorough statistics.
Require a symbol to measure above/Below or equal to a particular price level to “validate” a Long/Short entry signal. You can retrieve any data hosted by TradingView and require it measure above/below a user-defined level prior to entry. For instance, you can select "$VIX", and require the ticker to measure less than $30 prior to long/short entry. If "$VIX" measures greater than $30 prior to a long/short signal the position will not open. Alternatively, you can require a symbol to measure above a user-defined price prior to entry. If the retrieved ticker doesn't measure above the user-defined level prior to entry a trade will not open.
Use trailing stops or fixed stop losses
The image above shows results for 800 short-based RSI systems - using a trailing stop loss.
Test RSI crossunders and crossovers
The image shows results for 800 long-based RSI systems. Positions are entered subsequent to RSI crossovers.
You can select which RSI strategies are tested - you aren't not limited to testing RSI 2 - RSI 9 (:
Simulate limit orders (Exit intrabar at fixed stop losses or trailing stop losses; exit intrabar at profit targets)
The image above shows performance test results when exiting during the interval subsequent to the profit target being exceeded.
The image above shows performance test results when exiting during the interval subsequent to the stop loss being exceeded.
Require all tested RSIs to trend above or below their respective average (i.e. all RSIs must trend above/below their 50-interval EMA values. SMAs can also be used)
The image above shows an RSI EMA in addition to prerequisite condition. For each RSI strategy tested, the RSI used for the strategy must measure above an EMA of its values prior to entry. You can require RSI to measure below an EMA of its values prior to entry, use an SMA, and change the length of the MA used.
Use external indicators and require a user-defined value be exceeded, measured below, or that price exceed or measure below an indicator. The Self-Optimizing RSI indicator incorporates a few built-in technical indicators - ADX, %k, MFI, CMFI, and RSI. Consequently, you can require these indicators to measure above/below a specified level prior to entry. Additionally, you can supplement an extrinsic indicator (anything custom coded with plot values) to the entry logic for the Self-Optimizing RSI indicator. I'll show an example shortly.
The image above shows me requiring the ADX indicator to measure above "20" prior to long entry. Any of the built-indicators can be used with similar conditions; you can implement a custom-coded indicator for trade logic.
Additionally, you can supplement an extrinsic indicator (anything custom coded with plot values) to the entry logic for the Self-Optimizing RSI indicator.
The image above shows me retrieving the value for Volume Profile Point of Control - a TradingView coded indicator.
Consequently, I can require price to measure above/below the session's Poc prior to RSI long/short entry.
You can use this feature with any custom coded indicator providing historical plot values - something you or a favored author have coded.
]Adjust PT and SL percentages
The image above shows adjusted TP & SL percentages - optimize and reward/risk ratio you'd like (:
Override plot an RSI system to procure thorough statistics.
The image above shows manually plotted RSI parameters and a corresponding stat sheet.
Require a symbol to measure above/Below or equal to a particular price level to “validate” a Long/Short entry signal. You can retrieve any data hosted by TradingView and require it measure above/below a user-defined level prior to entry. For instance, you can select "$VIX", and require the ticker to measure less than $30 prior to long/short entry. If "$VIX" measures greater than $30 prior to a long/short signal the position will not open. Alternatively, you can require a symbol to measure above a user-defined price prior to entry. If the retrieved ticker doesn't measure above the user-defined level prior to entry a trade will not open.
The image above shows me requiring the ticker "$VIX" to measure below $30 prior to long/short entry. If %VIS measures greater than $30 when a long/short signal triggers a position will not be opened. Further refine your trading system with this feature - exploit correlations.
Adjust the time window that's tested.
The image above shows configurable start and end dates for the optimization period.
You won't be able to test 800 RSI strategies concomitantly on a 20,000 bar data set.
Consequently, for large data sets (intrasession data) you will have to narrow the optimization window to test a larger number of combinations.
You can test 80 (loads on all data sets), 144 (loads on all data sets), 264 (loads on ~15,000 bar data sets), 312 (loads on ~11,500 bar data sets) and 800 (loads on ~4950 bar data sets)combinations simultaneously. You can test 800 RSI strategies simultaneously on intrasession data; however, you'll likely have to narrow the tested time window.
I recently published a bar count script titled "Bar Count for Backtesting", you can access the script here:
The above script is useful for quickly calculating the number of bars in a time window, or the date for a bar that is "x" number of bars back. Therefore, implementing these scripts cooperatively should improve date selection efficiency (not arbitrarily selecting test start & end dates that fail to load).
I included a tool tip describing the near-maximum bars in a data set that the higher numbers of simultaneous RSI strategies can be tested on.
More to come; enjoy!
(P.S. The script uses private libraries and, consequently, is unable to be published open source)
An optimization script is best implemented to discover what won't work, not what will work. The best performing "optimized" parameters are not a guaranteed profitable investment system. While we may see an exceptionally positive performance for a set of parameters, it's impossible to know how much of that performance is the beneficiary of market noise in the absence of additional testing. Most market moves are noise - irreplicable sequences that offer no predictive utility - and most "good" backtests overwhelmingly benefit from these irreplicable sequences. An investor unfamiliar with this concept may be lead to believe they have found a valid correlation between an indicator sequence and subsequent price movement, despite the correlation being illusory.
Consequently, it should be assumed that the best performing parameters strongly benefitted from market noise and will not work in a live market - until further rigorous statistical tests are performed on an investment system built around the best performing parameters. This includes out-of-sample, in-sample, and forward testing in addition to testing negatively correlated, positively correlated and zero-correlation assets; testing additional assets should be treated as prerequisite to live implementation.
Of course, all trading strategies, even one's that methodically exploit a valid correlation/replicable sequence, will benefit from market noise - it's impossible to avoid. However, a "legit" trading strategy has a chance to work on future price data, while an overoptimized strategy will fail miserably on new price data!
An overoptimized strategy is virtually guaranteed to have a better backtest performance than a valid strategy. The overoptimized strategy will fail in a live market while the valid strategy has a chance of working. So, should you notice the best performing RSI parameters, be sure to build a comprehensive trading system around the parameters and perform additional tests. This is the only way to know if the optimized parameters will truly work in a live market!
Unfortunately, they often will not!
This publication does not constitute investment advice.
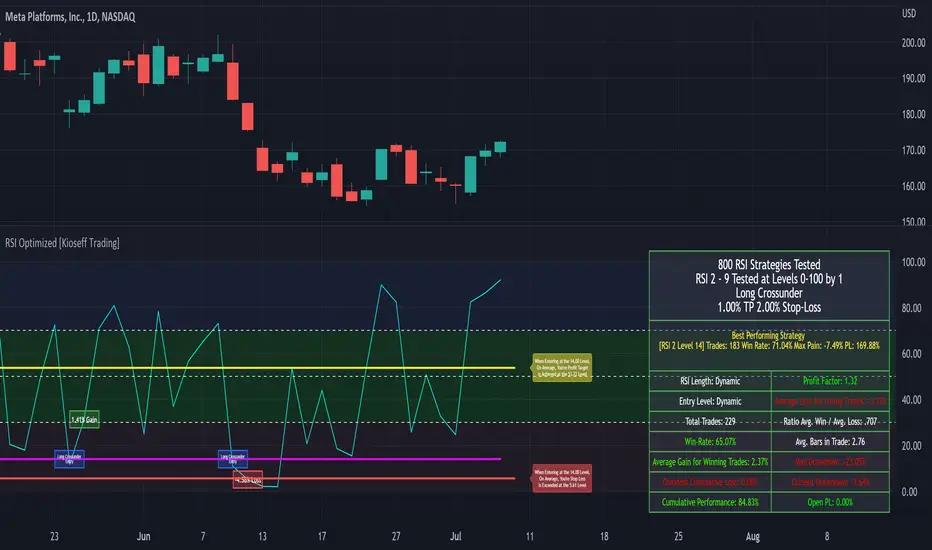
RVL Unreal Edge (concept build)Designed with a purpose, this script was intended for use by bots automating trading of XLM using a 6hr timeframe.
It's now being shaped into fantastic indicator on its own with very actionable signals and essentially zero lag. Much of the power behind it is derived from standard deviation/mean reversion strategies, and John Ehlers' incredible CG oscillator.
John Ehlers was an electrical engineer and Raytheon employee who began trading in the 1970's. He is best known for his work creating super-smoothing algorithms and methods of analysing cycle length and behaviour, and his work in the field of zero-lag indicators - indicators that don't follow the price action but are in fact capable of leading it actionably and responding with essentially zero lag.
By approaching the price action as a sine wave with a demonstrably fractal nature and thus subject to the phenomena of spectral dilation, Ehler's makes a number of important advancements. His CG indicator is derived from calculations typically used to derive the centre of gravity in a physical object. It effectively works as a band-pass filter, and is possibly one of the very best leading indicators available.
This script catches breakouts, tops and bottoms, leads reversals and the start/end of cycles. It functions as an excellent way to secure entries/exits around support and resistance. There are some methods of charting support and resistance built into the script currently, and lots more to add. One of the next major adjustments will be to hide or reduce the strength of buy/sell signals when price might be overextended (seen by the larger triangles, and + x symbols - these signal that a reversion back to the mean may be imminent).
The early version of this script had a 65% winrate and fantastic profit factor.
Stay tuned!
Support/Resistance:
The Ichimoku cloud, in this case has been custom tuned to the XLM 6 hour chart.
The 42 period EMA is a moving average that gets notable reactions from the price.
The 200 period EMA is the same.
The automatic Pitchfork almost always provides relevant Fibonacci based levels, but can sometimes require manually flicking through a few different presets to find a combination that fits the current price action. This will be automated in future.
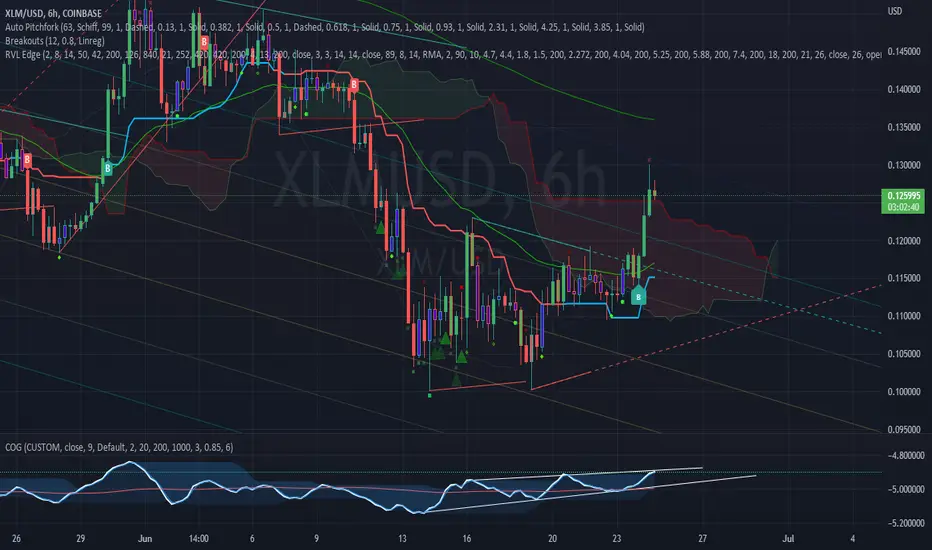
TUE ADX/MACD Confluence V1.0The ADX and MACD confluence can be a powerful predictor in stock movements. This script will help you find those confluences in an easy to understand visual manner.
It includes Buy and Sell signals for detected confluences, and will show colored candles to help you determine when to exit a trade. When the candles turn to white that means the detected confluence is no longer in play and you may want to consider a trailing stop loss.
The Buy and Sell signals will display on the first occurrence of each confluence.
It's important to understand that both of these are lagging indicators, but with a careful attention to your stoploss you can easily generate a positive profit factor.
This code is provided open source and you're free to use it for any purpose other than resale.
